How Do You Calculate Relative Standard Deviation — Easy Formula & Example
Understanding variability is central to data-driven decision making. Whether you are a laboratory analyst checking the precision of a measurement method, a statistician evaluating survey results, or a program manager assessing state-wise benefits and regional impact of policies, the question How to Calculate Relative Standard Deviation keeps coming up. This article provides a comprehensive, practical, and reader-friendly answer: the math, the intuition, step-by-step procedures, worked examples, historical background, policy-relevant uses (including applications to regional impact, women empowerment schemes, rural development, and social welfare initiatives), comparisons to related measures, pitfalls to avoid, and thoughtfully curated FAQs.
What is relative standard deviation and why it matters
Relative standard deviation (RSD) is a dimensionless measure of dispersion that expresses the standard deviation as a percentage of the mean. In plain terms, it answers: how large is the typical spread of values compared to the average value? Because it is expressed as a percentage, RSD is easy to compare across datasets with different units or scales.
RSD plays a crucial role in many fields:
- In analytical chemistry and laboratory quality control, RSD helps determine precision between repeated measurements.
- In public policy analysis, RSD can indicate the variability of indicators across states, enabling fair comparisons of state-wise benefits or the regional impact of programs.
- In monitoring and evaluation of social schemes—such as women empowerment schemes or rural development initiatives—RSD helps program managers understand consistency: are outcomes consistently delivered across regions, or do some districts show much more variability?
Because of its interpretability and scale-independence, many practitioners ask: How to Calculate Relative Standard Deviation in a robust and replicable way?
Short answer — the formula
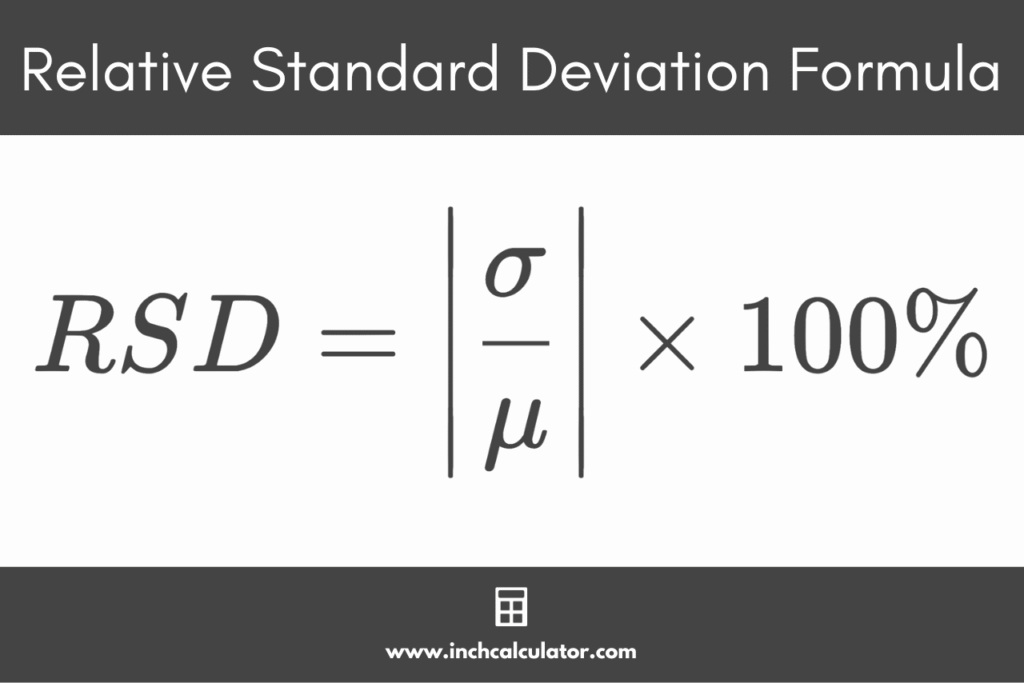
The concise mathematical answer to How to Calculate Relative Standard Deviation is:
- Calculate the arithmetic mean (average) of your dataset.
- Compute the standard deviation (usually the sample standard deviation).
- Divide the standard deviation by the mean.
- Multiply the result by 100 to express it as a percentage.
Symbolically, for a sample of nnn values x1,x2,…,xnx_1, x_2, \dots, x_nx1,x2,…,xn:
- Mean: xˉ=1n∑i=1nxi\bar{x} = \dfrac{1}{n}\sum_{i=1}^n x_ixˉ=n1∑i=1nxi
- Sample standard deviation: s=1n−1∑i=1n(xi−xˉ)2s = \sqrt{\dfrac{1}{n-1}\sum_{i=1}^n (x_i – \bar{x})^2}s=n−11∑i=1n(xi−xˉ)2
- Relative standard deviation: RSD=sxˉ×100%\text{RSD} = \dfrac{s}{\bar{x}} \times 100\%RSD=xˉs×100%
This is the backbone answer to How to Calculate Relative Standard Deviation, but the rest of this article shows how to apply it carefully and how to interpret results.
A brief history and development of the concept
The concept of relative measures of variability emerged as statisticians realized that absolute variability (like standard deviation) depends on the scale of measurement. To compare variability across different units—say, household income measured in rupees and years of education measured in years—statisticians developed normalized measures.
Relative standard deviation grew in popularity in the 20th century alongside quality control and analytical chemistry. Laboratories needed a standard, unitless metric to report reproducibility of assays; naming conventions vary (some fields call it coefficient of variation, CV). In fact, relative standard deviation and coefficient of variation are often used interchangeably: both are the standard deviation divided by the mean and expressed as a percentage.
As data-driven public policy expanded, practitioners adapted the RSD concept beyond the lab. Evaluators measuring regional impact of policies, comparing state-wise benefits, or assessing results across administrative units started using relative measures to allow fair comparisons. Today, RSD is a staple in many applied analysis toolkits.
Choosing the right version: population vs. sample RSD
When people ask How to Calculate Relative Standard Deviation, an important nuance arises: should you use population standard deviation or sample standard deviation?
- Population standard deviation divides by nnn: σ=1n∑(xi−μ)2\sigma = \sqrt{\dfrac{1}{n}\sum (x_i – \mu)^2}σ=n1∑(xi−μ)2.
- Sample standard deviation uses the unbiased estimator dividing by n−1n-1n−1: s=1n−1∑(xi−xˉ)2s = \sqrt{\dfrac{1}{n-1}\sum (x_i – \bar{x})^2}s=n−11∑(xi−xˉ)2.
Use population RSD when you genuinely have the entire population of interest (rare in practice). Use sample RSD—most common—when your dataset is a sample intended to estimate population parameters. When preparing reports or publishing results, clarify which you used: this answers potential reviewer questions and ensures reproducibility.
Step-by-step: How do you calculate relative standard deviation (worked example)
Let’s walk through a concrete example so the answer to How to Calculate Relative Standard Deviation is hands-on and clear.
Imagine we measured the yield (in kilograms) of a pilot agricultural program in 7 sample farms: 2.1, 2.4, 2.0, 2.6, 2.3, 2.2, 2.5.
Step 1 — mean:
xˉ=2.1+2.4+2.0+2.6+2.3+2.2+2.57=16.17≈2.300\bar{x} = \frac{2.1 + 2.4 + 2.0 + 2.6 + 2.3 + 2.2 + 2.5}{7} = \frac{16.1}{7} \approx 2.300xˉ=72.1+2.4+2.0+2.6+2.3+2.2+2.5=716.1≈2.300
Step 2 — sample standard deviation:
s=1n−1∑(xi−xˉ)2s = \sqrt{\frac{1}{n-1}\sum (x_i – \bar{x})^2}s=n−11∑(xi−xˉ)2
Compute squared deviations, sum them, divide by n−1=6n-1 = 6n−1=6, and take square root. Suppose s≈0.1924s \approx 0.1924s≈0.1924.
Step 3 — RSD:
RSD=0.19242.300×100%≈8.37%.\text{RSD} = \frac{0.1924}{2.300} \times 100\% \approx 8.37\%.RSD=2.3000.1924×100%≈8.37%.
Interpretation: The typical variation among farm yields is about 8.4% of the average yield. That helps program managers decide whether variation is acceptable or if some farms need targeted support.
This concrete walk-through answers How to Calculate Relative Standard Deviation in a reproducible, step-by-step manner.
Common variations and practical tips
Which mean to use?
The standard approach uses the arithmetic mean. However, when data are skewed or contain outliers (common in income, consumption, or program cost data), the mean may be misleading. Alternatives include:
- Reporting RSD alongside the median and interquartile range for skewed distributions.
- Using trimmed means if outliers are due to measurement errors.
Handling zero or near-zero means
If the mean is zero or very small, RSD becomes unstable or meaningless. For example, if average change is 0.02 and standard deviation is 0.05, RSD = 250% — technically correct but potentially misleading. When the mean approaches zero:
- Consider absolute measures (standard deviation alone) or other normalized metrics.
- Investigate whether the measurement scale is appropriate.
Units and interpretability
Because RSD is unitless, you can compare the consistency of different indicators: health outcome rates, expenditure per beneficiary, or training hours. This makes RSD useful when evaluating state-wise benefits or comparing program performance across regions.
Where RSD is applied in policy and development
When users ask How to Calculate Relative Standard Deviation they often want to apply it in an applied context. Here are real-world policy and program areas where RSD helps:
Regional impact and state-wise comparisons
RSD can quantify variability across states for indicators like per-capita benefit, enrollment rates, or vaccination uptake. For instance, if two regions have similar mean benefit amounts but one has a higher RSD, that region exhibits more unequal delivery—flagging an implementation problem.
Monitoring women empowerment schemes
Programs that target women’s economic empowerment yield multiple metrics: income change, participation rates in training, and access to credit. Using RSD across districts reveals whether the program achieves consistent results or if variability indicates unequal reach. A lower RSD across regions suggests stable program delivery.
Rural development and social welfare initiatives
In rural development, measures such as agricultural yield, household asset accumulation, or access to sanitation can be compared using RSD. This helps assess whether program design works uniformly or needs state-level tailoring.
These examples show why the theoretically straightforward answer to How to Calculate Relative Standard Deviation becomes practically powerful when combined with policy insight.
Interpreting RSD — what is “good” or “bad”?
There is no universal threshold for “good” RSD values; context matters.
- In laboratory chemistry, an RSD under 5% is often considered good precision; under 2% is excellent.
- In social program metrics, variability of 10–30% may be acceptable depending on heterogeneity of contexts and scale.
- When comparing administrative regions, a high RSD may indicate implementation gaps, diverse socio-economic baselines, or data quality problems.
Interpretation requires domain knowledge. Always combine RSD with absolute measures, visualizations (histograms, boxplots), and qualitative understanding of local contexts.
Comparing RSD with related measures
When answering How to Calculate Relative Standard Deviation, it helps to know what RSD is not and how it compares to similar statistics.
RSD vs. standard deviation
Standard deviation is in the same units as the data, so it’s useful when absolute spread matters. RSD expresses that spread relative to the mean so you can compare across scales.
RSD vs. coefficient of variation (CV)
They are the same concept; CV is widely used in some fields. The terms are interchangeable: both answer the question How to Calculate Relative Standard Deviation in the same way.
RSD vs. variance
Variance is the square of standard deviation and has squared units. RSD uses the standard deviation (not variance) divided by the mean and is therefore more interpretable.
RSD vs. relative error and percent difference
Relative error typically compares a measured value to a true value. RSD summarizes variability across multiple measurements. They answer different questions.
Dealing with data quality, sampling, and reporting
Calculating RSD correctly depends on quality data. Here are practical considerations:
Sample size matters
Small sample sizes produce unstable RSD estimates. If nnn is small (e.g., n < 10), interpret RSD cautiously and consider bootstrapped confidence intervals.
Outliers and extreme values
Outliers can inflate standard deviation and hence RSD. Before calculating RSD, investigate outliers: are they valid or data entry errors? Use robust summaries alongside RSD.
Reporting conventions
When presenting RSD:
- Indicate whether you used sample or population standard deviation.
- Show the mean and standard deviation as well.
- Provide sample size and, where appropriate, confidence intervals.
These steps help stakeholders understand the calculation and trust the reported RSD.
Implementation: computing RSD in common tools
Knowing How to Calculate Relative Standard Deviation mathematically is one thing; implementing it reliably is another. Here are short recipes for common tools.
Spreadsheet (Excel / Google Sheets)
- Mean: =AVERAGE(range)
- Sample standard deviation: =STDEV.S(range) (or STDEV in older Excel)
- RSD: =STDEV.S(range)/AVERAGE(range)*100
R (programming language)
x <- c(…) # your vector
rsd <- sd(x) / mean(x) * 100
Use sd() for sample standard deviation.
Python (pandas / numpy)
import numpy as np
x = np.array([…])
rsd = np.std(x, ddof=1) / np.mean(x) * 100
In each case, remember the ddof=1 setting (or equivalent) to compute sample standard deviation.
Case study: using RSD for state-wise benefits monitoring
Imagine a national cash-transfer program distributing benefits across 20 states. Analysts compute the average benefit amount and RSD for each state to evaluate consistency of delivery.
- If State A has an RSD of 4% and State B has an RSD of 35%, State B exhibits much higher variability: some beneficiaries received much less or much more than the average. Higher RSD might reflect operational issues (inconsistent targeting), different payment mechanisms across districts, or data recording inconsistencies.
Program managers can use RSD as a triage tool: high-RSD states are prioritized for audits, process reviews, or additional training for local implementers. When combined with qualitative field visits, RSD provides a quantitative anchor for decision-making.
This is a practical demonstration of why practitioners ask How to Calculate Relative Standard Deviation and how the answer drives action.
Success stories: when RSD guided improvements
Several contexts illustrate success when RSD was applied:
- Health supply chains: A regional health department tracked stock levels of essential medicines across clinics. High RSD revealed inconsistent stocking practices; targeted logistics changes reduced RSD from 48% to 12% within a year, improving availability.
- Training program delivery: An NGO used RSD to measure training hours delivered per trainee across districts. High RSD pointed to quality control issues; after standardizing curricula and monitoring, RSD fell and average outcomes improved.
- Agricultural extension services: RSD of yield improvement across pilot plots highlighted variance due to soil type differences. That insight led to targeted soil-testing support and better yield consistency.
These stories show the practical value of the simple calculation: How to Calculate Relative Standard Deviation — then act on what it reveals.
Challenges and limitations
No measure is perfect. When answering How to Calculate Relative Standard Deviation, be aware of limitations:
- Mean sensitivity: RSD depends on the mean; in datasets with near-zero mean, it becomes unreliable.
- Not informative about distribution shape: Two datasets can have identical RSDs but different distribution shapes (e.g., bimodal vs. normal).
- Sample size and representativeness: RSD from non-representative samples can mislead program choices.
- Context-dependent interpretation: What’s small in a lab might be large in public policy.
Because of these limits, always use RSD alongside other descriptive statistics and domain knowledge.
Best practices for reporting and using RSD in decision-making
- Report the mean, standard deviation, sample size, and RSD together.
- Choose sample or population formulas deliberately and state your choice.
- Visualize distributions with histograms or boxplots—RSD is a summary but visuals tell more.
- When comparing regions, control for structural differences—for instance, compare RSDs among similar-sized states or use stratification.
- Use RSD as an early-warning indicator, not the sole decision rule: follow up with diagnostics.
- Combine quantitative RSD analysis with qualitative field insights, especially for programs like women empowerment schemes and rural development initiatives.
These practices ensure the calculation of RSD leads to meaningful action rather than misleading conclusions.
Advanced topics and variants
Bootstrapped confidence intervals for RSD
When sample sizes are small or data are non-normal, bootstrapping can produce confidence intervals for RSD, giving a measure of uncertainty and improving inference.
Weighted RSD
If observations have different weights (e.g., district-level indicators where population varies), compute weighted mean and weighted standard deviation before deriving weighted RSD. This ensures the RSD reflects the intended population distribution.
Log-transformed RSD
For log-normal data, transform data using logarithms, compute standard deviation on the log scale, and interpret variability multiplicatively. This is common in income or expenditure data.
Each of these methods extends the basic answer to How to Calculate Relative Standard Deviation to more complex but realistic settings.
Comparing RSD across time: monitoring program consistency
RSD is useful not only across space (regions or states) but also over time. Monitoring how RSD evolves month-to-month or year-to-year can reveal whether program delivery is becoming more consistent. For example:
- A declining RSD over time suggests convergence toward more uniform delivery.
- Spikes in RSD can indicate disruptions: policy changes, funding inconsistencies, or external shocks.
For policy analysts tracking state-wise benefits or implementation of social welfare initiatives, this temporal lens yields early warnings and helps evaluate reforms.
Integrating RSD into dashboards and KPIs
Dashboards that show mean values alongside RSD give stakeholders a fuller view of performance. For instance, a dashboard for a national program might show for each state:
- Average benefit amount
- Standard deviation
- RSD (as a percentage)
- Sample size
Color-coded thresholds can highlight states with high RSD for follow-up. When designing KPIs, consider whether lower RSD should be an explicit target (e.g., “RSD < 15% across districts”) depending on program goals.
Example: calculating RSD for a women empowerment training program
Suppose a training program measures monthly income change for women participants in 10 villages. The incomes (in local currency units) are: 1200, 1250, 1100, 1300, 1280, 1190, 1225, 1270, 1150, 1235.
Following the steps to answer How to Calculate Relative Standard Deviation:
- Compute mean: sum/10.
- Compute sample standard deviation using n−1n-1n−1.
- Divide standard deviation by mean and multiply by 100.
If RSD is low, income improvements are consistent across villages. If RSD is high, the program team should investigate whether some villages lack market access, face cultural barriers, or need more targeted support—linking statistical insight with programmatic action.
Frequently encountered mistakes in practice
- Using population standard deviation without justification.
- Ignoring small sample sizes.
- Misinterpreting RSD when the mean is near zero.
- Failing to complement RSD with visualizations.
- Comparing RSD across heterogeneous groups without stratification.
Avoid these mistakes to ensure your answer to How to Calculate Relative Standard Deviation translates into sound decisions.
Future prospects: RSD in the age of big data and AI
As datasets become larger and more complex, RSD retains value as a simple, interpretable statistic. Automated monitoring systems, machine learning models, and real-time dashboards can incorporate RSD to flag anomalies in program delivery. For example:
- Near-real-time RSD calculation across districts can spot sudden variability in service delivery.
- RSD can be an input feature in predictive models that forecast program underperformance.
Coupling RSD with richer analytics helps stakeholders move from descriptive summaries to prescriptive actions—scaling up what began with the simple answer to How to Calculate Relative Standard Deviation.
Concluding summary
Relative standard deviation answers a fundamental question: how variable is a dataset relative to its mean? To compute it, calculate the mean, find the standard deviation (sample or population), divide, and multiply by 100. In practice, RSD is a versatile, unitless indicator useful across laboratory sciences, policy evaluation, and program monitoring. When applied to regional impact analyses, state-wise benefits comparisons, women empowerment schemes, rural development programs, and social welfare initiatives, RSD illuminates consistency and inequities, guiding targeted improvements. Use it thoughtfully—considering sample size, distribution shape, and data quality—and always present RSD alongside other statistics and visualizations.