How to Calculate Standard Deviation in Excel — Step-by-Step Guide
Understanding variation is central to good decision-making. Whether you’re a student learning basic statistics, a data analyst evaluating program outcomes, or a policy maker assessing regional impact, knowing how to calculate standard deviation in Excel is an essential skill. This article walks you through the concept, the history and purpose of standard deviation, step-by-step Excel techniques (from basic formulas to advanced automation), practical examples tied to policy frameworks and state-level benefits, common pitfalls, comparisons with other tools, and future prospects. By the end you’ll not only know how to calculate standard deviation in Excel, but also how to apply it to real-world problems like evaluating women empowerment schemes, rural development projects, and other social welfare initiatives.
What standard deviation measures and why it matters
Standard deviation is a summary statistic that quantifies the dispersion — how spread out a set of numbers is around their mean. In plain language, it tells you whether values cluster near the average or are widely scattered. If you’re analyzing test scores, income data, or program impact metrics, standard deviation helps you understand consistency and risk. Learning how to calculate standard deviation in Excel is therefore the practical bridge between raw numbers and actionable insight.
Historically, the idea of measuring spread goes back to the 19th century as statisticians formalized tools to describe probability distributions. Over time, standard deviation became a cornerstone of modern statistics because of its mathematical properties and interpretability. For analysts working with policy frameworks and state-level benefits, being able to compute standard deviation quickly — for instance, to compare variability across districts — allows for fairer comparisons and better targeting of resources.
Common definitions: population vs sample
Before we focus on Excel, it’s crucial to distinguish two common scenarios: population and sample. If you have data for an entire population (e.g., every household in a district), you use the population standard deviation formula. If your data are a sample drawn from a larger population (e.g., a survey of households), you use the sample standard deviation, which adjusts for sample size and provides an unbiased estimate.
Knowing which one applies is the first step in learning how to calculate standard deviation in Excel correctly. Excel provides distinct functions depending on which measure you need, and choosing the wrong one can bias your conclusions — a serious risk when evaluating social welfare initiatives or comparing state-wise benefits.
Excel’s built-in functions for standard deviation
Excel includes several functions to compute standard deviation. The most commonly used are:
- STDEV.S(range) — computes the sample standard deviation (use when your data are a sample).
- STDEV.P(range) — computes the population standard deviation (use when you have the whole population).
- Legacy functions in older Excel versions such as STDEV and STDEVP perform similar calculations but are superseded by the above for clarity.
A direct way to learn how to calculate standard deviation in Excel is to practice each function with example data. For a quick demonstration, enter a series of numbers in column A and use =STDEV.S(A1:A10) to compute sample SD or =STDEV.P(A1:A10) for the population SD. These functions handle the arithmetic internally, saving you from manual calculations.
Step-by-step: How to calculate standard deviation in Excel (basic)
If you want a clear procedure, follow these steps in Excel. This paragraph style walkthrough shows you how to calculate standard deviation in Excel for a simple dataset without relying on add-ins.
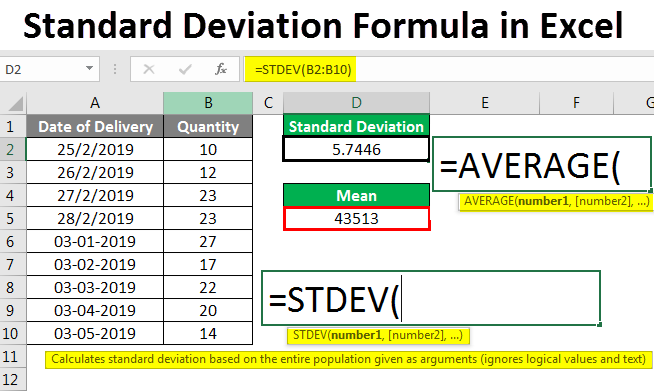
First, prepare your data in a single column or row, making sure values are numeric and blank cells are avoided (or intentionally included with awareness of how Excel handles blanks). Next, decide whether your dataset is a sample or a population. If it’s a sample, use STDEV.S; if it’s a population, use STDEV.P. Type the function into an empty cell, for example =STDEV.S(B2:B51), and press Enter. Excel returns the standard deviation as a numeric value. If you prefer to see the calculation steps explicitly, you can compute the mean with =AVERAGE(B2:B51), subtract the mean from each value in a helper column, square those deviations, sum them using =SUM(…), divide by n-1 (for a sample) or n (for a population), and then apply =SQRT(…) to get the standard deviation. This manual method teaches the underlying math behind how to calculate standard deviation in Excel.
Worked example: test scores
Imagine a teacher recording ten test scores in cells B2 through B11. To compute the sample standard deviation, the teacher enters =STDEV.S(B2:B11) and gets a single figure that conveys how consistent or variable the class performance is. If the teacher needs to compare variability across classes or across states in a larger educational study, understanding how to calculate standard deviation in Excel enables consistent, reproducible analysis that supports better policy recommendations about resource allocation or school improvement programs.
Using the Data Analysis ToolPak
Excel’s Data Analysis ToolPak offers a user-friendly interface for statistical procedures including descriptive statistics that report standard deviation. To use it, activate the ToolPak via Excel Options, then navigate to Data → Data Analysis → Descriptive Statistics. Select your input range, check the options for summary statistics, and Excel generates a table that includes mean, standard deviation, variance, and more. For practitioners evaluating regional impact or state-wise benefits across many indicators, the ToolPak speeds up reporting and helps standardize audits of program performance — a core part of designing robust policy frameworks.
Handling missing values and non-numeric entries
When learning how to calculate standard deviation in Excel, you’ll encounter messy datasets. Excel functions generally ignore text and blank cells in the numeric range, but this behavior can be a double-edged sword. If missing values indicate nonresponse or a skipped measurement, you should examine patterns of missingness before computing standard deviation because the effective sample size changes. Use COUNT(range) to know how many numerical values exist, and consider imputation or exclusion strategies depending on the analysis goals. For example, project evaluators assessing social welfare initiatives should document how missing data are handled since state-level conclusions can hinge on seemingly small differences in how variability is measured.
Weighted standard deviation and special cases
Not all datasets are equal. Suppose each observation has a different importance — for instance, when combining district-level outcomes weighted by population to compute a national indicator. In that case, the unweighted standard deviation misrepresents the true dispersion. Excel doesn’t have a built-in weighted standard deviation function, but you can compute it manually: calculate the weighted mean, compute weighted squared deviations, sum them, divide by the sum of weights (or the effective degrees of freedom for a sample), and then take the square root. Mastering weighted calculations expands your competence in how to calculate standard deviation in Excel when evaluating policy frameworks where units (districts, schools, households) are not equally sized.
Using PivotTables and group-wise standard deviations
When analyzing state-wise benefits or comparing performance across regions, PivotTables are indispensable. If you place region identifiers in rows and the numeric indicator in values, you can set the aggregation to “StdDev” or “StdDevp” depending on whether you treat each group as a sample or a population. PivotTables make it easy to compute standard deviation across many groups at once, which is perfect for comparative studies of regional impact or for monitoring multiple social welfare initiatives simultaneously.
Visualizing variability: charts and interpretation
Standard deviation is best interpreted alongside visual tools. Create histograms, boxplots (via Excel’s charting or through add-ins), or error-bar charts to visualize spread and identify outliers. When presenting results to policy makers or stakeholders, show both mean and standard deviation to communicate not only the average effect of a women empowerment scheme or rural development program, but also how predictable that effect is across regions. This deeper insight is a compelling example of why learning how to calculate standard deviation in Excel is more than an academic exercise — it directly improves decision-making.
Case study: evaluating a rural development program
Consider a hypothetical case study where a national agency evaluates an agricultural productivity program rolled out across 20 districts. Each district reports yield increases. By computing district-wise means and standard deviations in Excel, analysts can identify districts with highly variable outcomes, signaling implementation inconsistency. Excel functions for standard deviation, combined with PivotTables and conditional formatting, allow the team to spot hotspots needing technical support. This kind of analysis, which hinges on knowing how to calculate standard deviation in Excel, supports a responsive policy framework that optimizes state-wise benefits by targeting resources to areas with both low average gains and high variability.
Success stories and applied examples
Success stories help translate method into impact. A state-level education department used Excel standard deviation calculations to discover that schools with similar average test scores differed markedly in variability; schools with higher variability had more pronounced inequality among students. The department then piloted targeted tutoring in the most variable schools. Another example is a healthcare NGO that used Excel to monitor vaccination campaign coverage across subdistricts; calculating standard deviation allowed them to focus outreach where coverage was inconsistent. These narratives illustrate how the technical question of how to calculate standard deviation in Excel can directly inform strategies to improve social welfare initiatives.
Challenges and common pitfalls
There are several traps when applying standard deviation in Excel. The most frequent are confusing sample and population functions, misinterpreting the meaning of a high or low SD without context, and failing to account for outliers or nonnormal distributions. Excel’s functions won’t warn you if your data violate assumptions; they simply return numbers. Another challenge is overreliance on single metrics: a standard deviation without complementary measures (median, interquartile range, or counts) may mislead. In policy evaluation — such as assessing state-level benefits — decision-makers should triangulate evidence rather than base decisions solely on a single standard deviation value. Understanding these pitfalls is part of mastering how to calculate standard deviation in Excel responsibly.
Comparisons with other tools: R, Python, and Google Sheets
Excel is ubiquitous and familiar, but other tools offer advantages. R and Python provide flexible libraries, reproducible scripts, and superior handling of large datasets. For instance, Python’s numpy.std() or R’s sd() functions let you compute standard deviation programmatically and integrate into machine-learning pipelines. Google Sheets mirrors many Excel functions and supports cloud collaboration. However, for many practitioners — especially at district or state agencies with limited technical capacity — Excel is the practical default. Knowing how to calculate standard deviation in Excel equips a broad audience with immediate analytical power while allowing those who need scale to migrate workflows to R or Python later.
Advanced Excel techniques: formulas, LET, and dynamic arrays
Power users often combine Excel’s new features to streamline analysis. The LET function allows you to name intermediate calculations (like mean and squared deviations) for clarity and performance. Dynamic arrays (in Office 365) automatically spill results for helper columns and make iterative computations cleaner. If you’re asking how to calculate standard deviation in Excel in a workbook that needs to recalculate frequently, using LET and array formulas can reduce errors and improve transparency. For policy analysts producing regular performance dashboards, these functions simplify maintenance and auditing of calculations.
Automating with VBA and Power Query
When you need to compute standard deviations repeatedly across many files or integrate diverse datasets (for example, state-wise reports), automation pays off. Power Query can consolidate data from multiple Excel files or databases, clean it, and prepare ranges for statistical functions. VBA macros can apply STDEV.S or STDEV.P to multiple sheets and export summary tables. These automation pathways show advanced yet practical ways to scale your knowledge of how to calculate standard deviation in Excel into organizational workflows that back policy evaluations and program monitoring.
Quality control and reproducibility
When reporting results that influence funding or policy, reproducibility is non-negotiable. Document whether you used sample or population SD, list ranges and filters applied, and store raw data and formulas in a version-controlled workbook. Use sheet protection and clear naming conventions so auditors can trace how you calculated each metric. These practices are essential if your standard deviation calculations feed into evaluations of women empowerment schemes, social welfare initiatives, or regionally distributed benefits. Again, the technical ability to calculate SD in Excel must be matched by robust governance around data handling.
Interpreting standard deviation in context
A numeric standard deviation has meaning only relative to the scale of measurement and the distribution shape. For example, a standard deviation of 5 is large if the mean is 10 but small if the mean is 500. Use coefficients of variation (standard deviation divided by mean) when comparing dispersion across indicators with different units, such as income and test scores. This comparative approach is invaluable for cross-sector analyses — for instance, comparing variability in maternal health indicators to variability in school enrolment rates — and demonstrates mature application of how to calculate standard deviation in Excel beyond rote computation.
Communicating findings to stakeholders
Translating statistical measures into actionable advice is a core skill. When presenting results to officials responsible for state-wise benefits or regional development, avoid jargon. Explain that standard deviation measures consistency and that high variability often signals uneven implementation. Pair standard deviation with maps, charts, and concrete recommendations: allocate technical support to high-variability districts, consider pilot programs in areas with low average performance, or identify outliers for targeted investigation. Clear communication ensures that the technical answer to “how to calculate standard deviation in Excel” becomes a tool for meaningful change.
Ethical considerations and responsible use
Data-driven policymaking carries ethical responsibilities. Ensure privacy by anonymizing sensitive data before sharing workbooks, and avoid misrepresenting variability in small samples where standard deviation may be unstable. When using Excel to analyze social welfare initiatives, transparency about methods — including how you calculated standard deviation — is essential for public trust. Ethical stewardship elevates the technical skill of knowing how to calculate standard deviation in Excel into a practice that respects people and communities represented in the data.
Practical tips and shortcuts
Several pragmatic tips help you calculate and use standard deviation in Excel more effectively. Always label your ranges and consider named ranges for clarity. Use COUNT and COUNTA to check the number of numeric and nonblank entries. Create templates that include both the STDEV.S and STDEV.P formulas with explanatory comments so colleagues understand which to use. Conditional formatting can visually highlight high variability. These small efficiencies speed routine analyses and make your understanding of how to calculate standard deviation in Excel more portable across teams.
Future prospects: from spreadsheets to intelligent analytics
The future of spreadsheet analysis is increasingly integrated with AI, cloud computing, and interactive dashboards. Excel continues to evolve with features that support larger datasets, faster calculations, and more transparent formulas. As agencies digitize monitoring of social welfare initiatives and state-wise benefits, spreadsheets will likely coexist with programmatic analytics. However, the foundational skill of knowing how to calculate standard deviation in Excel will remain valuable, because many stakeholders rely on Excel for quick, verifiable summaries before delegating complex modeling to specialized tools.
Comparative outlook: when to use Excel and when to scale
Use Excel when your datasets are moderate in size, your audience is diverse, and you need rapid, verifiable calculations. Switch to R or Python when analysis requires repeatable scripts, advanced modeling, or integration with large administrative databases. In either case, the conceptual understanding of variability and how to compute it — which starts by learning how to calculate standard deviation in Excel — is transferable and should be part of every analyst’s toolkit.
Bringing it into policy and program evaluation
When evaluating policy frameworks and regional programs, standard deviation informs whether average outcomes are equitably distributed. For example, two districts might share the same average income increase after a program, but if one exhibits a larger standard deviation, benefits may be unequally distributed among beneficiaries. Therefore, routine reporting should include both mean and standard deviation to assess fairness and consistency. That approach makes data more actionable when planning future phases of women empowerment schemes or rural development projects.
Checklist: prepare your workbook for robust SD calculations
Before you calculate standard deviation in Excel for operational reports, follow this checklist: verify numeric formats, decide on sample vs population, handle missing values intentionally, use named ranges, document formulas, test calculations on known examples, and create visualizations to support interpretation. This disciplined approach ensures your results are accurate and defensible when informing decisions on state-wise benefits or resource allocation.
Final thoughts
Mastering how to calculate standard deviation in Excel empowers you to transform raw data into insights that matter. From classroom assessments to national program evaluations, standard deviation is a compact, powerful metric that illuminates variability and informs targeted action. When combined with careful data governance, transparent reporting, and thoughtful communication, Excel-based standard deviation calculations become catalysts for smarter policies and better outcomes across regions.