Mean & Standard Deviation Calculator
Calculate mean and standard deviation (population or sample) with detailed results and visual graph
Standard Deviation Distribution Graph
Step-by-Step Solution
The dataset entered: 41, 35, 55, 56, 57
Count of numbers (N): 5
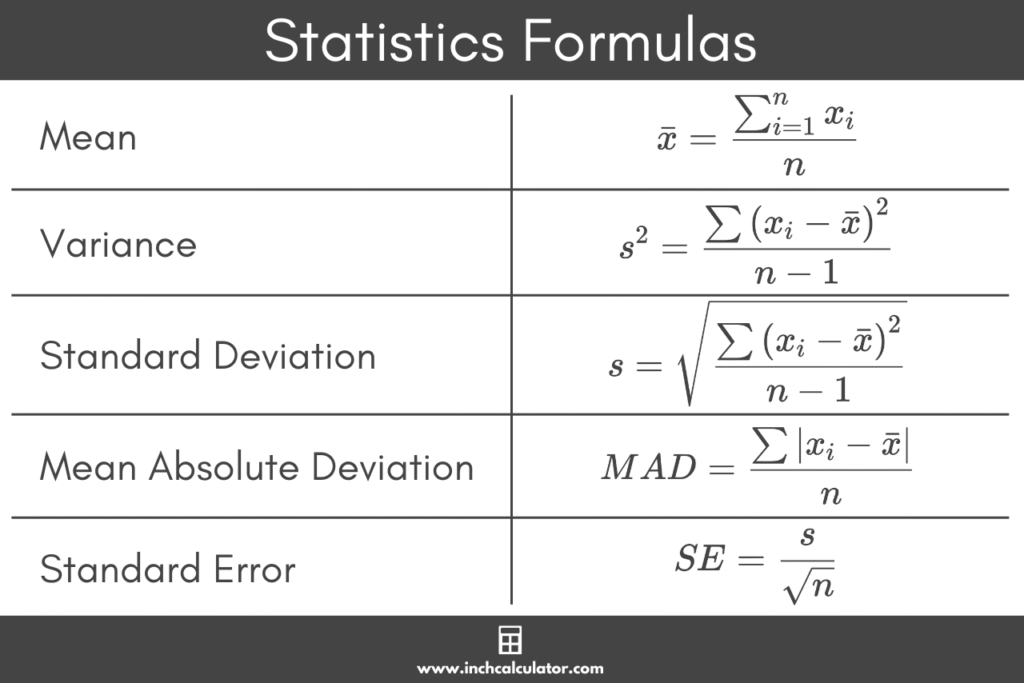
Mean (μ) = Sum of all values / Count of values
μ = (41 + 35 + 55 + 56 + 57) / 5 = 244 / 5 = 48.8
Mean: 48.8
For each value, subtract the mean and square the result:
| Value (x) | Deviation (x – μ) | Squared Deviation (x – μ)² |
|---|---|---|
| 41 | -7.8 | 60.84 |
| 35 | -13.8 | 190.44 |
| 55 | 6.2 | 38.44 |
| 56 | 7.2 | 51.84 |
| 57 | 8.2 | 67.24 |
| Sum | – | 408.8 |
For population: Variance (σ²) = Sum of squared deviations / N
σ² = 408.8 / 5 = 81.76
Variance: 81.76
Population Standard Deviation (σ) = √Variance
σ = √81.76 ≈ 9.0421
Standard Deviation: 9.0421
Statistics plays an indispensable role in shaping decisions, policies, and strategies across disciplines ranging from education and economics to social welfare and healthcare. Among the core statistical tools, the Mean & Standard Deviation Calculator stands as one of the most practical, widely used, and powerful resources for researchers, students, policymakers, and professionals. It simplifies complex numerical data into understandable measures of central tendency and variability.
In this long-form article, we will explore the history, objectives, and applications of mean and standard deviation, explain the role of calculators (both manual and digital), analyze their significance in various domains, and provide insights into regional impact, policy frameworks, rural development, women empowerment schemes, and social welfare initiatives where these statistical measures are vital. This comprehensive discussion is designed to deliver in-depth clarity, ensure SEO optimization, and engage readers with relevant comparisons, examples, and future prospects.
Understanding the Mean and Standard Deviation
What is the Mean?
The mean, often referred to as the average, is the sum of all values in a dataset divided by the number of observations. It represents the central point of data distribution and offers an easy way to understand where most values lie. For example, when calculating the mean income in a rural community, policymakers can understand the standard living condition and design welfare schemes accordingly.
What is Standard Deviation?
The standard deviation is a measure of dispersion that shows how spread out the numbers are in relation to the mean. A low standard deviation indicates data points are clustered near the mean, while a high standard deviation suggests wide variability. In sectors like healthcare, education, or economic planning, this tool is invaluable in identifying inequalities, risks, and anomalies.
Why Both Metrics Matter Together
While the mean gives a central value, it does not tell us how consistent or variable the data is. Standard deviation complements this by showing whether values are close to the mean or scattered widely. For example, two states may have the same mean literacy rate, but one may show a higher standard deviation, indicating unequal distribution of literacy across regions.
Evolution of Statistical Tools and Calculators
The journey of statistical analysis began centuries ago, with early civilizations recording population counts, crop yields, and trade balances. Over time, as data grew more complex, so did the need for reliable tools.
- Manual Computation Era – Early statisticians relied on manual calculations, which were prone to errors and time-consuming. Computing the mean and standard deviation required significant effort, particularly with large datasets.
- Mechanical Calculators – The invention of mechanical calculators in the 17th and 18th centuries accelerated the process. These devices, though primitive, allowed faster arithmetic.
- Digital Revolution – By the late 20th century, computers and calculators made statistical operations far more efficient.
- Online Tools & Apps – Today, the Mean & Standard Deviation Calculator is accessible online for free. These tools allow instant computation, visualization, and even integration with databases for real-time analytics.
This evolution reflects how statistics has transitioned from theory to practical application, enabling better decision-making across global and regional contexts.
Objectives of Using a Mean & Standard Deviation Calculator
The use of a calculator for mean and standard deviation is not limited to academics. Its objectives spread across multiple sectors:
- Accuracy: Reducing human error in manual computation.
- Speed: Delivering instant results for large datasets.
- Accessibility: Allowing students, teachers, policymakers, and researchers easy access.
- Policy Design: Informing welfare initiatives and economic programs through accurate data insights.
- Comparative Analysis: Enabling comparisons across states, regions, and demographics.
- Monitoring Impact: Evaluating whether development schemes are reducing inequality (measured by standard deviation in income, education, etc.).
Implementation in Real-World Scenarios
Education
In education, analyzing student performance requires both mean and standard deviation. For instance, the mean marks of a class indicate overall performance, while the standard deviation reveals whether most students performed similarly or if there was a wide gap. Such insights guide teaching methods, curriculum reforms, and state-level education policies.
Healthcare
Health ministries and local bodies use statistical calculators to monitor disease outbreaks, vaccination coverage, and healthcare accessibility. A high standard deviation in health indicators suggests disparities in rural vs. urban healthcare delivery.
Economic Planning
When governments assess income distribution, poverty levels, or employment rates, mean and standard deviation calculations become crucial. They allow the creation of targeted programs for regions with high inequality.
Social Welfare Initiatives
Social welfare programs, especially those focusing on women empowerment schemes or rural development, rely heavily on statistical tools. For example, if the mean monthly income of women in a district is lower than the state average with high variability, policymakers may launch skill training and microfinance programs to address the gap.
Regional Impact of Statistical Applications
The regional impact of the Mean & Standard Deviation Calculator is significant in federal systems where states or provinces require customized strategies.
- State-Level Education Programs: States with wide disparities in student performance (high standard deviation) may need region-specific interventions.
- Healthcare Delivery: Comparing state-level healthcare outcomes highlights which regions need urgent attention.
- Rural vs. Urban Divide: Rural development policies often hinge on identifying where mean income or standard deviation indicates unequal growth.
By adopting calculators, local administrators can tailor welfare initiatives, track progress, and ensure inclusivity in development.
Policy Framework and Statistical Relevance
Governments worldwide rely on robust policy frameworks that are data-driven. The Mean & Standard Deviation Calculator serves as a technical backbone in:
- Budget Allocation: Identifying states with higher inequality for larger funding.
- Social Justice: Ensuring equitable distribution of resources by identifying marginalized groups.
- Monitoring Women Empowerment Schemes: Evaluating the success rate of self-help groups, skill development initiatives, and microcredit schemes.
- Sustainable Rural Development: Assessing agricultural productivity, water resource usage, and income variability among farmers.
For example, a rural development program aiming to double farmer incomes must consider not just the average income but also how uniformly benefits are distributed.
State-Wise Benefits and Applications
Each state or region derives specific benefits from using statistical calculators.
- High-Literacy States: Focus shifts from average performance to narrowing standard deviation in marginalized communities.
- Agriculture-Dependent States: Standard deviation in crop yields helps identify districts vulnerable to drought or climate change.
- Industrial States: Wage inequality assessments are vital for labor welfare initiatives.
- Tourism-Dependent States: Calculating mean revenue and deviations across districts helps boost balanced growth.
Thus, the calculator is not just an academic tool but a practical instrument shaping development pathways.
Women Empowerment and Statistical Monitoring
Women empowerment schemes often focus on financial independence, literacy, and health. However, their success must be measurable. Here, the Mean & Standard Deviation Calculator plays a critical role.
- Income Distribution Among Women: The mean income shows general progress, while the standard deviation indicates whether empowerment is reaching rural and marginalized women.
- Literacy Rates: Reducing variability in women’s literacy across regions is a primary goal.
- Entrepreneurship Programs: Tracking standard deviation in loan repayment rates among women entrepreneurs highlights where support mechanisms are needed.
Statistical monitoring ensures accountability, making sure that empowerment is not just on paper but reflected in tangible improvements across states.
Rural Development and the Role of Statistics
Rural development is a multidimensional concept involving infrastructure, employment, healthcare, and education. Calculators for mean and standard deviation allow administrators to:
- Identify average rural household incomes and detect inequality.
- Track the spread of healthcare access, showing whether benefits are concentrated in a few regions.
- Evaluate agricultural productivity, highlighting whether certain districts lag significantly.
- Compare states to prioritize funding and technical support.
By reducing statistical disparities, rural development can become more inclusive and equitable.
Social Welfare Initiatives and Statistical Backing
Social welfare initiatives require measurable targets and reliable monitoring mechanisms. Without statistical tools, it becomes impossible to assess effectiveness.
- Poverty Alleviation: Mean income growth combined with low standard deviation signals broad-based welfare success.
- Food Security Programs: Variations in nutritional indicators across states highlight gaps.
- Skill Development Programs: Standard deviation in employment rates after training helps evaluate program reach.
By using calculators, welfare initiatives shift from guesswork to evidence-based governance.
Success Stories: When Statistics Made the Difference
Several case studies illustrate the transformative role of statistical monitoring.
- Education Equality in Kerala (India): By identifying districts with higher standard deviation in literacy, targeted interventions reduced inequality significantly.
- Microfinance Programs in Bangladesh: Mean income growth among women, coupled with a narrowing standard deviation, showed widespread impact.
- Healthcare in Rural Africa: Standard deviation in vaccination coverage highlighted regions left behind, enabling targeted campaigns.
These stories prove that data-driven governance leads to sustainable progress.
Challenges in Statistical Application
Despite its usefulness, implementing statistical analysis faces challenges:
- Data Quality Issues: Inaccurate or incomplete data can distort mean and standard deviation calculations.
- Technological Gaps: Rural administrators may lack access to advanced calculators or digital platforms.
- Awareness: Policymakers may focus on averages without considering variability.
- Implementation Costs: Gathering detailed data requires funding and trained manpower.
- Resistance to Change: Traditional governance models may resist adopting evidence-based frameworks.
Addressing these challenges requires capacity building, awareness campaigns, and investment in digital infrastructure.
Comparison with Other Statistical Tools
While the Mean & Standard Deviation Calculator is critical, it is not the only tool. Comparing it with others provides perspective:
- Median and Mode Calculators: Useful when data is skewed, but they lack insight into variability.
- Variance Calculator: Similar to standard deviation but expressed in squared units, making interpretation harder.
- Regression Tools: Predict trends but rely heavily on accurate mean and deviation values.
This comparison shows why mean and standard deviation remain fundamental for both basic and advanced statistical analysis.
Future Prospects of Mean & Standard Deviation Calculators
The future of statistical calculators lies in integration with big data, artificial intelligence, and machine learning. As societies become more data-driven, these calculators will:
- Enable real-time policy adjustments.
- Predict inequalities before they widen.
- Integrate with mobile apps for grassroots monitoring.
- Support global development goals by ensuring no region is left behind.
By embedding these tools into governance, businesses, and education, societies can ensure inclusive growth.
FAQs on Mean & Standard Deviation Calculator
Conclusion
The Mean & Standard Deviation Calculator is far more than a mathematical tool; it is a bridge between raw data and meaningful decisions. From guiding women empowerment schemes to shaping rural development policies, it ensures that averages are not misleading and inequalities are not hidden. By understanding both central tendencies and variability, governments, institutions, and individuals can design inclusive strategies, track progress effectively, and foster sustainable development.
As the world embraces data-driven decision-making, the role of these calculators will only expand—making them essential for shaping not only academic research but also social welfare, economic planning, and global development goals.